Introduction
If you’ve ever opened MetaTrader 4 (MT4) or MetaTrader 5 (MT5) and felt overwhelmed by flashing lines, candles, and numbers—you’re not alone. Reading a Forex chart is one of the first skills every trader must master.
In this guide, we’ll walk you through how to read Forex charts step-by-step, identify trends, recognize patterns, and use simple indicators to confirm your decisions. By the end, you’ll be able to interpret charts confidently and even enhance your analysis using MT4 / MT5 indicators or Expert Advisors (EAs)—available free and premium on Payhip.
📊 What Is a Forex Chart?
A Forex chart visually displays currency price movements over time. Each point represents how much one currency is worth compared to another (for example, EUR/USD).
Horizontal axis: shows time (minutes, hours, days).
Vertical axis: shows price.
Each chart helps you understand market direction, volatility, and entry/exit zones.
Why it matters: Every trading decision—buy, sell, or hold—starts with reading a chart correctly.
🧩 The Three Main Types of Forex Charts
1️⃣ Line Chart – Simplicity First
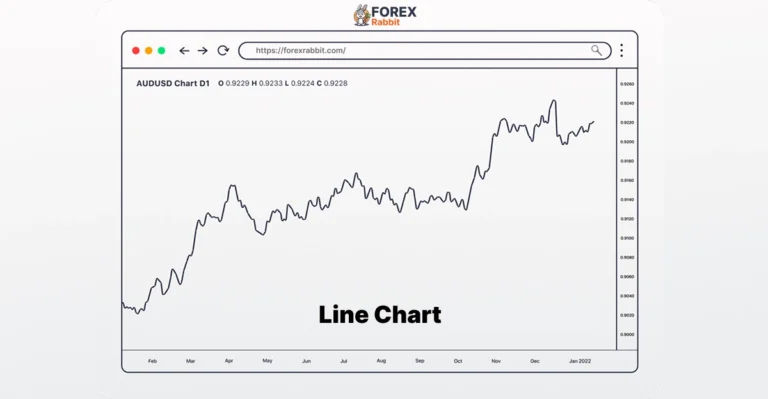
The line chart connects closing prices over time.
✅ Great for spotting general trends.
🚫 Not ideal for detailed price action.
Best for: beginners and long-term trend identification.
2️⃣ Bar Chart – More Details
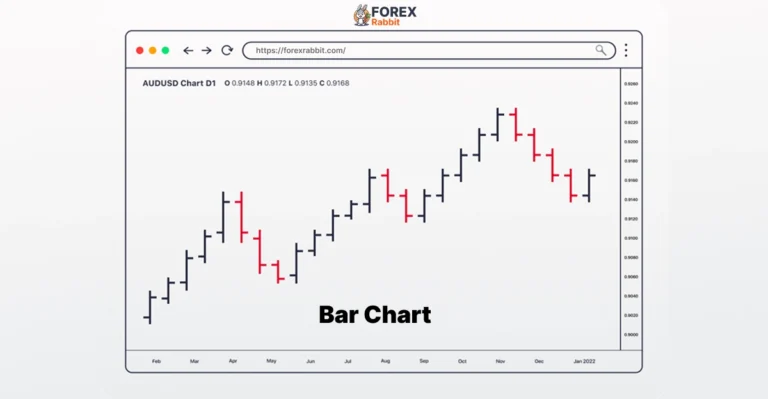
Bar charts (also called OHLC charts) show the Open, High, Low, Close prices for each period.
✅ Shows price range and volatility.
🚫 Can look cluttered for beginners.
3️⃣ Candlestick Chart – The Trader’s Favorite
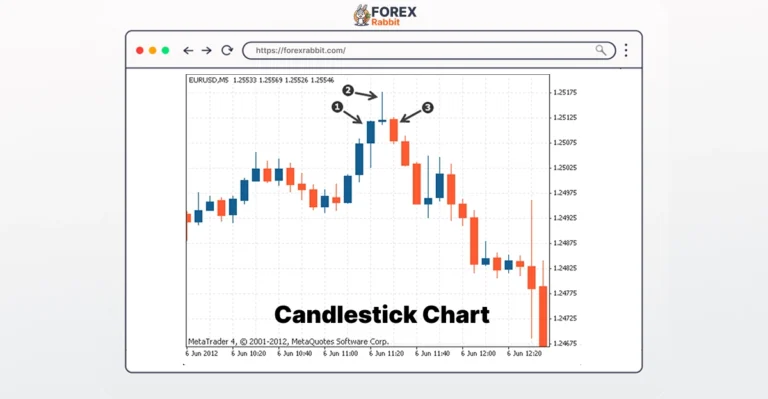
Candlestick charts are the most used in Forex trading.
Each “candle” shows the same OHLC data, but in a clearer, color-coded format.
Anatomy of a Candlestick:
Body: the range between open & close.
Wicks (shadows): the highest & lowest prices.
Color: Green = bullish (up); Red = bearish (down).
💡 “A candlestick shows how price moved in a time period—its body shows open and close, and the wicks show highs and lows.”
⏱ Choosing the Right Time-Frame
Different traders use different time-frames:
1 min – 15 min: scalping/day trading.
1 H – 4 H: swing trading.
Daily – Weekly: long-term trading.
Beginners should start with 1-hour or 4-hour charts—these show clear patterns without too much noise.
🔄 Pro Tip: Use multi-time-frame analysis—check a higher chart (daily) for trend direction, then lower charts (1 H) for entries.
🧱 Key Chart Elements Every Beginner Must Know
📈 Trend
Price usually moves in uptrends, downtrends, or sideways ranges.
Draw trendlines along price swings to visualize direction.
💪 Support & Resistance
Support: a price level where demand prevents further fall.
Resistance: a price level where supply stops price rise.
When price breaks these levels, it often signals a trend continuation or reversal.
📐 Chart Patterns
Recognizing shapes helps forecast market moves.
Common ones:
Head & Shoulders – signals reversal.
Double Top/Bottom – trend reversal zone.
Triangles/Flags – continuation setups.
⚙️ Technical Indicators
Indicators confirm what charts suggest.
Moving Averages (MA): smooth out trends.
RSI: measures overbought/oversold levels.
MACD: shows momentum changes.
👉 Try our free MT4 / MT5 Moving Average Indicator here for visual confirmation of trends.
🖥 Step-by-Step: Reading a Live MT4 / MT5 Chart
1️⃣ Open MT4 or MT5 → choose a currency pair (EUR/USD).
2️⃣ Select Chart Type → Candlestick recommended.
3️⃣ Set Time-Frame → 1 H or 4 H.
4️⃣ Add Indicators → e.g., Moving Average, RSI.
5️⃣ Identify Trendlines, Support, Resistance.
6️⃣ Wait for Confirmation. For instance, RSI > 70 = overbought → possible sell signal.
7️⃣ Use EAs for automation → let software scan patterns for you.
🎯 Example:
Price bounces from support + MA cross = strong buy setup.
A free MT4 indicator can alert you automatically (get one at Payhip.com/ForexRabbit).
🤖 Boosting Accuracy with Indicators & Expert Advisors (EAs)
Free Indicators: Great for beginners testing simple strategies.
Paid Indicators / EAs: Advanced automation, multiple signals, back-tested performance.
Our ForexRabbit EA Suite automatically recognizes candlestick patterns and alerts you to high-probability setups.
👉 Download from Payhip →
⚠️ Common Beginner Mistakes
❌ Adding too many indicators (chart overload).
❌ Ignoring higher-time-frame trends.
❌ Trading without confirmation signals.
❌ Blindly trusting EAs without understanding chart context.
Remember: Indicators & EAs support your analysis—they don’t replace it.
📘 Quick Reference Cheat SheetChecklist Before a Trade:
| Chart Type | Best For | What to Look For |
|---|---|---|
| Line | Overall trend | Simplicity |
| Bar | Volatility | Price range |
| Candlestick | Detailed analysis | Patterns & signals |
✅ Check trend direction
✅ Mark support & resistance
✅ Confirm signal with indicator
✅ Set stop-loss & take-profit
❓ FAQs
Q1. What’s the easiest chart for beginners?
A candlestick chart—clear and visual, used by most traders.
Q2. What’s the best time-frame for beginners?
Start with 1-hour or 4-hour charts to reduce noise.
Q3. Can I rely only on indicators?
No. Use them to confirm what the chart already shows.
Q4. MT4 or MT5—which is better for chart reading?
Both are excellent. MT5 has faster execution + more indicators, but MT4 remains beginner-friendly.
✅ Conclusion & Next Steps
You’ve now learned the basics of reading Forex charts—chart types, time-frames, patterns, and indicators.
The next step is practice: open a demo account and start marking trends. When you’re ready, enhance your workflow using our free MT4/MT5 indicator or upgrade to a premium EA for automated chart analysis — all securely available on Payhip.
📥 Download Free Indicator Now → Payhip Store
🎓 Join ForexRabbit Membership for access to premium tools & weekly chart analysis.